Graph plotting
Graphs.jl integrates with several other Julia packages for plotting. Here are a few examples.
TikzGraphs.jl
Another nice graph visualization package. (TikzPictures.jl required to render/save):
julia> g = wheel_graph(10); t = plot(g)

julia> save(SVG("wheel10.svg"), t)
producing a graph like this:

GraphPlot.jl
Another graph visualization package that is very simple to use. Compose.jl is required for most rendering functionality:
julia> using GraphPlot, Compose

julia> g = wheel_graph(10)

julia> draw(PNG("/tmp/wheel10.png", 16cm, 16cm), gplot(g))
SGtSNEpi.jl
SGtSNEpi.jl is a high-performance software for swift embedding of a large, sparse graph into a d-dimensional space (d = 1,2,3). The Makie plotting ecosystem is used for interactive plots.
using GLMakie, SGtSNEpi, SNAPDatasets

GLMakie.activate!()

g = loadsnap(:as_caida)
y = sgtsnepi(g);
show_embedding(y;
  A = adjacency_matrix(g),        # show edges on embedding
  mrk_size = 1,                   # control node sizes
  lwd_in = 0.01, lwd_out = 0.001, # control edge widths
  edge_alpha = 0.03 )             # control edge transparency
The above code produces the following output:

SGtSNEpi.jl enables 3D graph embedding as well. The 3D embedding of the weighted undirected graph MLGraph/optdigits10NN is shown below. It consists of 26,475 nodes and 53,381 edges. Nodes are colored according to labels provided with the dataset.
GraphRecipes.jl
GraphRecipes.jl contains several recipes for plotting networks using the Plots.jl ecosystem. There are a lot of different recipes and styles to choose from, check out the examples page to see more of them.
using Plots, GraphRecipes
g = wheel_graph(10)
graphplot(g, curves=false)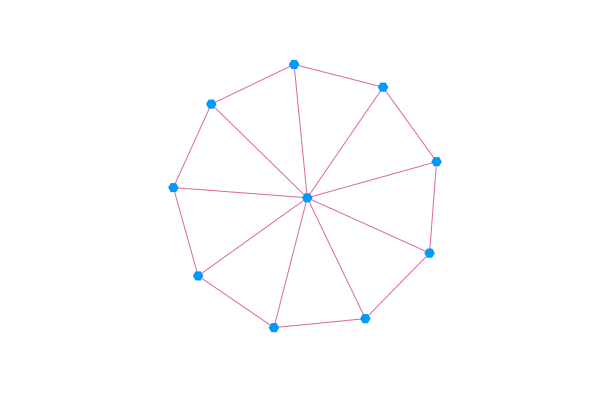
GraphMakie.jl
GraphMakie.jl is a graph plotting recipe for the Makie.jl ecosystem. It uses NetworkLayout.jl for the node placement and supports 2D and 3D plots. Check out the docs for more examples and tutorials.
using GLMakie, GraphMakie
using GraphMakie.NetworkLayout

g = smallgraph(:dodecahedral)
graphplot(g; layout=Stress(; dim=3))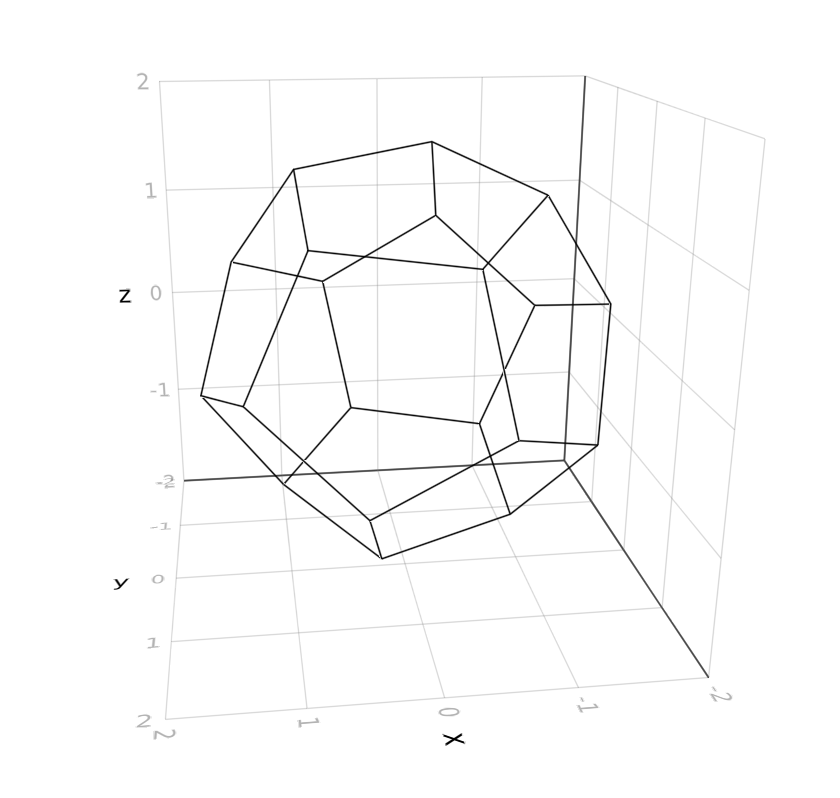
Karnak.jl
The Karnak.jl package integrates the Luxor.jl 2D graphics package, and uses NetworkLayout.jl for calculating layouts. Check out the docs for examples.
using Graphs
using Karnak
using NetworkLayout
using Colors
g = barabasi_albert(60, 1)
@drawsvg begin
    background("black")
    sethue("grey40")
    fontsize(8)
    drawgraph(g,
        layout=stress,
        vertexlabels = 1:nv(g),
        vertexfillcolors =
            [RGB(rand(3)/2...)
               for i in 1:nv(g)]
    )
end 600 400